When you start working with performance testing tools like k6, you’ll quickly notice metrics such as p95, p90, or p60 in the results. But what do these values represent, and how should you interpret them?
The idea is simple
p(95) (95th percentile) means:
- 95% of your requests were faster than or equal to this value
- only 5% were slower
That’s it.
How it works behind the scene
You run a test in k6 and make 100 requests.
Each request has a response time:
– 120 ms
– 314 ms
– 90 ms
– 1200 ms
….
– 900 ms
Step 1
Pull all response times into a list
Step 2
Sort them from fastest to lowest.
Step 3
Look at position number 95
That value is your p(95)
Why not just use the average?
Because averages can hide problems.
Example:
- 95 requests → 200 ms
- 5 requests → 5 seconds
The average might still look “fine”.
But in reality?
5% of users are having a terrible experience.
Percentiles expose that.
What about p(90), p(99), etc.?
Same idea, different cutoffs:
- p(90) → 90% of requests are faster than this
- p(95) → 95%
- p(99) → 99% (this shows edge cases / worst experiences)
The higher the percentile, the closer you get to the “pain zone”.
How it looks in k6
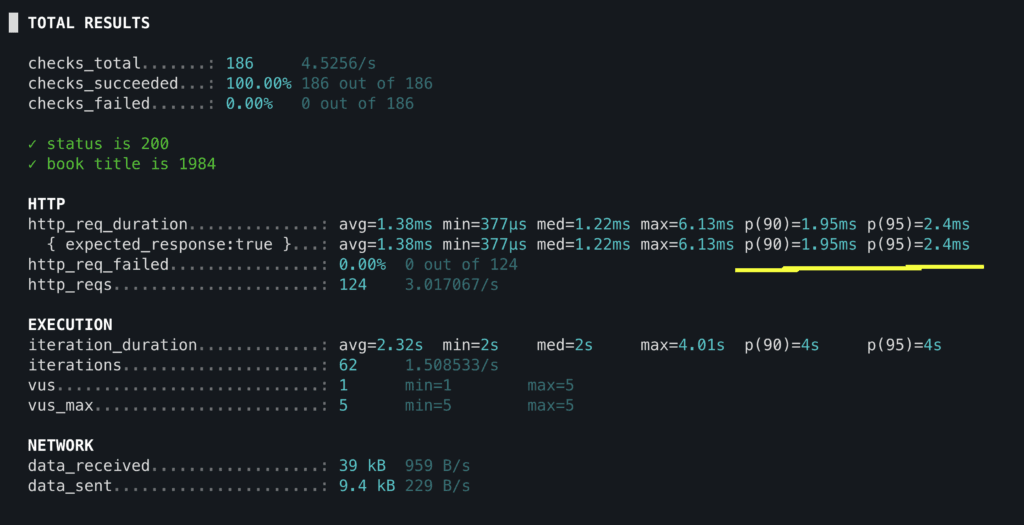
Quick interpretation:
For this test, I used a local server application, and most users are very fast (< 1.95 ms)
→ 90% of requests complete almost instantly
Almost everyone gets a great response time (< 2.4 ms)
What this tells us
This is actually a very healthy system:
The gap between p(90) and p(95) is small → consistent performance
The gap between p(95) and max exists → a few outliers (normal in real systems)
All values are in milliseconds, not seconds → excellent response time overall
In short:
Most users get lightning-fast responses, and even the slowest ones are still fast.
Common mistake
A lot of people think: “95% of requests took exactly 2.4 ms”
NOT TRUE!!!
It means “up to 2.4 ms”, not “exactly 2.4 ms”.